Introduction
I’ll present a project that simply measures the temperature by reading a sensor. Afterwards, we’ll expand on it by introducing memory storage (Project 2 and time-stamped readings (Project 3).
The Theory
How I2C is different from SPI
SPI has 4 wires: MISO, MOSI, CS/SS, SCK. I2C only has 2.
By giving each device an address, we can drop the SS line. By forcing all communication to occur on one wire, we drop MISO/MOSI. This means communication is half-duplex and bidirectional.
Voila! Just like that we’ve arrived at 2 wires – SDA/SCK. Contrast this with 4 wires for SPI.
How I2C Works
SDA can only toggle when SCK is low EXCEPT for START/STOP conditions.
Data is only read when SCK is high.
Every I2C transaction begins with a 7-bit address.
Since SDA is bidirectional, we attach an 8th bit, the R/W bit. This conveys the direction of communication flow. If its set, the Master is receiving (or READING) data. If pulled low, Master is WRITING data.
If the Master or Slave receives data, they must either ACK or NACK. This is a 9th-bit sent after every byte. SPI doesn’t have this error detection. Therefore, an I2C data transaction is always 9 bits long.
START/STOP conditions are generated exclusively by the master. Thus, the slave is unable to initiate or terminate conversation. It’s response is received via ACK/NACK.
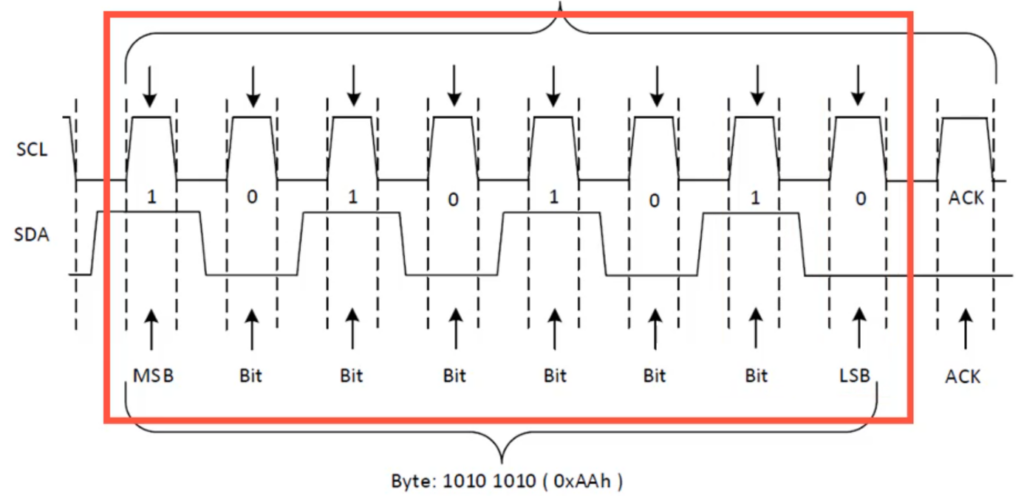
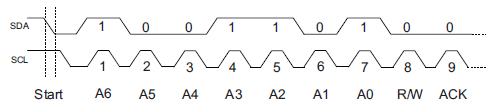
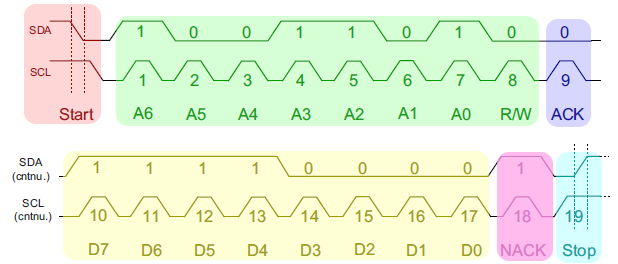
A complete I2C transaction
- Master generates a START condition (Red)
- Master sends 7-bit slave address along with an extra bit at the end (R/W bit). (Green)
- Slave transmits an ACK by pulling SDA low (Blue)
- Master responds by transmitting a data byte (Yellow)
- Slave responds with ACK/NACK. (Pink)
- If NACK is submitted, Master responds by generating a STOP condition (Teal)
Project 1 – I2C Thermometer
This project will read the temperature from a LM75 and print it to the serial terminal every 3 seconds.
Wait? What’s a LM75
Aah. Good question. The information about I2C at the beginning wasn’t a waste of time because you see, the LM75 (and many many other sensors) communicates via I2C.
Description
The LM75 is a digital temperature sensor. It has an integrated Sigma-Delta ADC and I2C interface. This means we avoid any messy signal acquisition and filtering. We obtain the 9-bit temperature by politely asking it via I2C with an accuracy of ±2°C.
We can set it with a programmable limit with hysteresis via over-temperature output (O.S). In this configuration, the OS pin is set when a certain temperature threshold is reached.
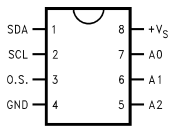
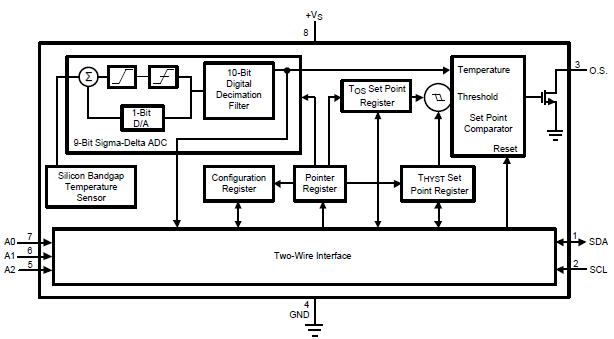
For it’s 7-bit address, the first 4 (MSB) are hardwired into the silicon. The last 3 can be configured by connecting to A0, A1, A2 pins.

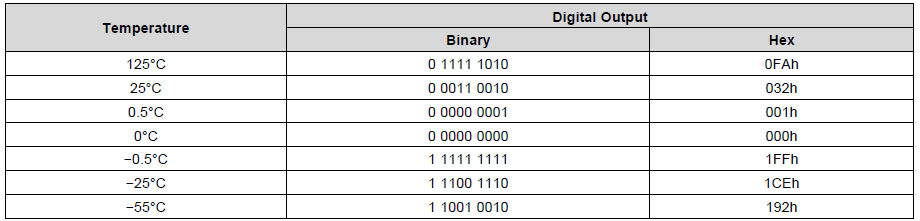
The temperature data is read from the Temperature (T_OS) Set Point and (T_HYST) Set Point registers. The temperature from 125°C to -55°C is mapped to 0FAh – 192h. The MSB represents the sign.
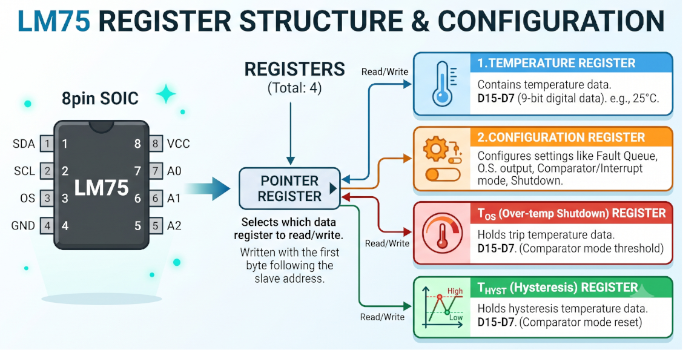
Register Structure
AI cooked
Hardware Connections
The schematic is located in my GitHub repository.
Highlights
- A0, A1, A2 is grounded, setting last 3 address bits to 000.
- 10kΩ pullup resistors on I2C bus (as recommended by datasheet, page 18)
The Software
This project consists of an I2C driver and main.c. Full source code available in my GitHub repository. Thanks to the hardware I2C/TWI, the software is quite sparse. The hardware is doing the majority of the heavy lifting. The I2C driver implements the register access to facilitate I2C.
NOTE: Pay attention to the MakeFile. Some files are imported from folders with specific file locations.
At the beginning of main.c, I extract the pointers of the 4 registers and address for read/write operation from the datasheet.
An infinite while loop where the read operation is performed via I2C. The steps in A complete I2C transaction are implemented in code. The result is then printed to serial terminal via print_uint8().
The information below contains the address of the LM75
The first 4 digits 1001 is hard-wired to the LM75. The other 3 is determined by the connections to A0, A1, A2. Since their all grounded, the address this is 000. That is 4 + 3 = 7 bits. This is a standard I2C 7-bit address.
#define LM75_ADDRESS_W          0b10010000
#define LM75_ADDRESS_R          0b10010001
The last bit, LSB is R/W bit. A Read = 1, Write = 0. Recall that an I2C address is 7-bits. Last bit is R/W bit. When we want to send data we send 1001000. When we want to read data we send 10010001.
The Showcase
You can see when I bring fire close to the sensor, it’s readings increase (as it should).
Project 2 – Logging Thermometer
Now that I’ve validated the LM75 temperature sensor works, let’s add a 24LC256 EEPROM IC to develop a temperature logger.
NOTE: The 24LC256 was covered in extensive detail in 16. Working with the 24LC256 EEPROM IC.
Hardware Connections
2 devices are connected to the I2C bus.
The schematic is available in my GitHub repository.
The Software
NOTE: The I2C and 25LC256 driver from previous projects are re-used. Hooray for code re-usability. Full source code available at the GitHub repository.
On power-up, a configuration menu appears and waits for input. The user can interact with the logger from here, but if no selection is made within MENU_DELAY (5 seconds), the menu times out and the program begins logging temperature readings to the EEPROM.
The top of main.c sets up the groundwork: pointers to the four registers and the read/write address are pulled from the datasheet, followed by the 25LC256 macros. The menu is then printed, and a switch/case captures and processes whatever the user selects.
| Key | Option | What it does |
|---|---|---|
< | Shorten sample delay | Subtracts 5 s from the reading interval. Guarded by seconds_delay >= 10, so shortest reachable interval is 5 s. |
> | Lengthen sample delay | Adds 5 s, up to 65 000 s (~18 hours). |
r | Reset delay to 60 s | Self-explanatory |
p | Print log over serial | Walks EEPROM from MEMORY_START (byte 4) to the current write pointer in 7-byte strides, decoding each record to YYYY-MM-DD HH:MM:SS, XX.X degrees. |
e | Erase memory | Clears the whole 32 KB chip (~3 s), then re-seeds the two config words: write pointer back to MEMORY_START. |
s | Start logging | (cut off in the screenshot) |
The Showcase
| Timestamp | Description |
|---|---|
| 0:00 – 0:08 | Testing invalid inputs |
| 0:07 – 0:11 | Reset delay time |
| 0:11 – 0:16 | Shorten delay time |
| 0:16 – 0:22 | Increase delay time |
| 0:22 – 0:23 | Reset delay time |
| 0:24 – 0:38 | Clearing EEPROM |
| 0:39 – 0:47 | Commencing logging |
Project 3 – Logging Thermometer with time-stamped readings
I left the temperature logger logging overnight. It accrued 248 readings. However, without a timestamp, the readings are meaningless. I can’t interpret this. Let’s add a DS3231 RTC IC and time-stamp each sensor reading.
Here are the new additions:
- The readings are dumped into a
.csvfile, dump_log.py - A Python script plots it, plot_log.py
Hardware Connections
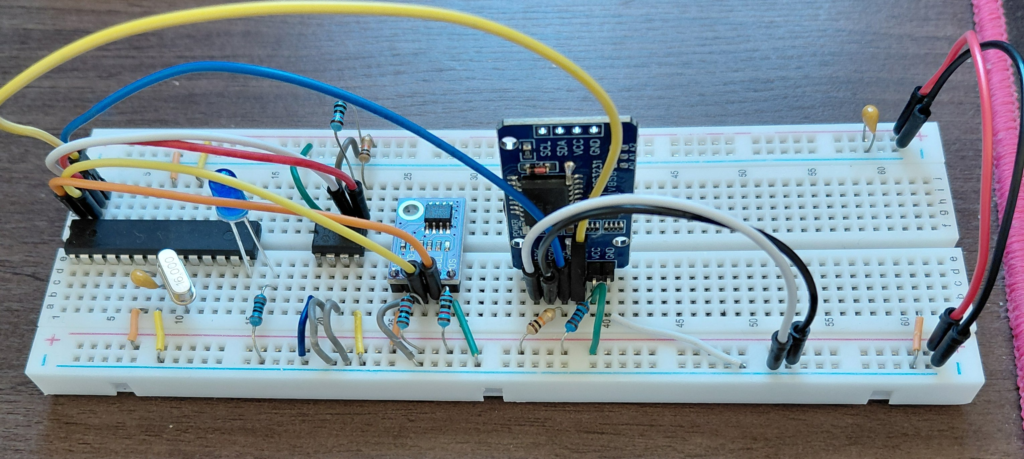
We have 3 devices connected on the I2C bus.
The schematic is available in my GitHub repository.
The Software
The source code is expanded with the addition of the DS3231 driver and two scripts. Full source code available at the GitHub repository.
Hardware Definitions
The top of main.c establishes the I²C groundwork: the LM75’s 7-bit address shifted into read (0x91) and write (0x90) forms, and its four internal register pointers — temperature, config, THYST, and TOS — taken from the datasheet. The 24LC256 macros follow, defining an address map where the first four bytes hold two persistent 16-bit config words (the next-write pointer and the sampling interval), with log records beginning at MEMORY_START.
The Record Structure
log_record_t defines one timestamped reading: six calendar/clock bytes matching rtc_time_t, plus a single packed temperature byte. The struct is compiled with -fpack-struct so it lays out as exactly seven contiguous bytes, which is what makes byte-by-byte serialization to EEPROM safe.
Temperature packing is worth noting: the LM75’s 9-bit reading is compressed into one byte with the integer degrees in bits 7:1 and the 0.5 °C flag in bit 0.
Helper Layer
UART printing helpers handle unpadded and zero-padded decimal output, with print_timestamp() assembling YYYY-MM-DD HH:MM:SS (century hardcoded as 20xx, since the DS3231 stores only a two-digit year). eeprom_read_record() and eeprom_write_record() walk the struct byte-by-byte to and from a given address.
Setting the Clock
set_clock() prompts for each field in turn via prompt_field(), populating an rtc_time_t instance t — year, month, date, hour, minute, second — and passes it to ds3231_set_time(). This only needs running once; the module’s coin cell holds time through power cycles.
The Menu
Largely unchanged from the earlier version, with one addition: t to set the clock. The existing options handle adjusting the sample interval, erasing memory, and dumping the log over serial.
Logging Loop
Each iteration reloads the write pointer from EEPROM, reads the current time via ds3231_read_time() into a fresh rec, then performs the LM75 read — write the pointer register, repeated START, read two bytes with an ACK then a NACK. The two bytes are packed into rec.temp, the record is printed and written to EEPROM, and the pointer advances only if a full seven bytes still fit before the chip’s end. The LED then toggles once per second through the inter-reading delay as a heartbeat.
The Showcase
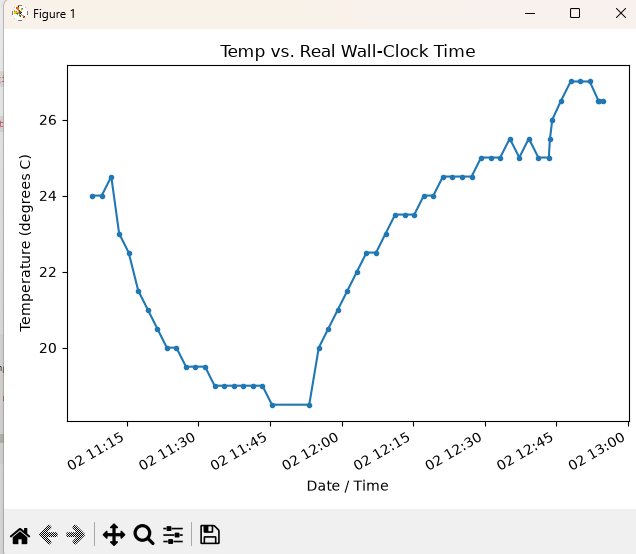
After I run make plot, it executes the Python script, generating a beautiful time-stamped log.
NOTE: The dip at the bottom at 11:45 – 12:00 is deliberate as I transported the circuit into the garage. Afterwards, I transported it into the room and cranked up the heater. This explains the subsequent rise in readings.